


Mastering Trading View: Strategies for Effective Market Analysis and Profitable Trading

Introduction to Trading View and Its Market Capabilities
In the rapidly evolving world of financial markets, having a reliable and comprehensive platform is essential for traders and investors alike. trading view has established itself as one of the most powerful tools available, offering an extensive suite of features tailored for market analysis, real-time data monitoring, and community-driven insights. With a broad user base across the globe, Trading View has become synonymous with advanced charting, social engagement, and strategic trading, making it a versatile choice whether you’re a beginner or a seasoned professional.
Understanding the Trading View Platform
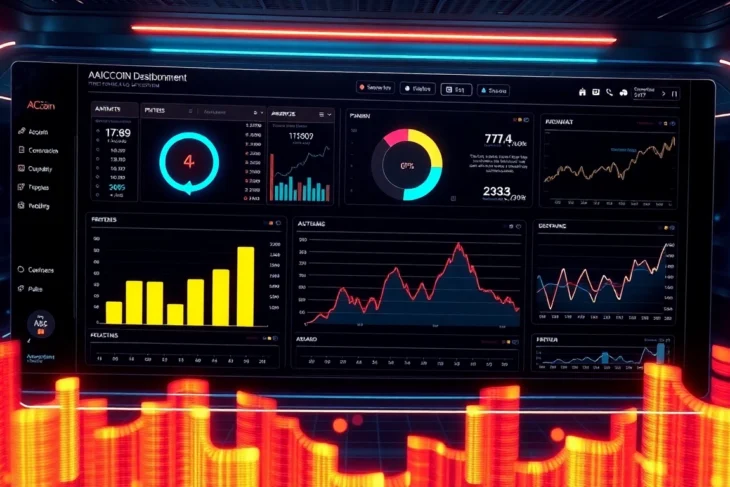
At its core, Trading View is more than just a charting tool; it is a comprehensive social and analytical ecosystem. The platform integrates real-time market data from global exchanges, covering stocks, cryptocurrencies, forex, commodities, and indices. Its cloud-based architecture means that users can access their setups from any device without software installation—be it desktop, tablet, or smartphone.
The interface is intuitively designed, emphasizing ease of use while providing advanced functionalities for detailed technical analysis. This blend of user-friendly features and sophisticated tools lends itself well to both individual investors and institutional traders. Additionally, Trading View’s social features—such as idea sharing, chats, and community forums—facilitate collaborative learning and the exchange of insights, making it a vibrant hub for market enthusiasts.
Core Features for Traders and Investors
Robust Charting and Technical Tools
One of Trading View’s standout features is its ultra-flexible charting platform. Users can choose from a variety of chart types—candlestick, line, bar, area, Renko, Heikin-Ashi, and more—to suit their analysis style. Over 100 technical indicators are available, including moving averages, RSI, MACD, Bollinger Bands, and Fibonacci retracements. Moreover, custom scripts can be created using Pine Script, enabling tailored strategies and indicators.
Real-Time Data and Alerts
Accurate, real-time market data is vital for making timely decisions. Trading View aggregates feeds from multiple exchanges, delivering live updates on price movements, volume, and trading signals. Users can set personalized alerts based on price levels, indicator crossovers, or specific trading patterns—these notifications can be delivered via SMS, email, or push notifications, ensuring traders never miss critical market shifts.
Community and Social Integration
The platform’s social features allow traders to publish analysis, share trading ideas, and engage in discussions directly within the platform. This community-driven environment fosters collaborative learning and provides diverse perspectives, which can be invaluable for refining strategies and staying ahead of market trends.
Multi-Device Accessibility and Compatibility
Trading View’s cloud infrastructure ensures seamless synchronization across devices. Whether on a desktop web browser or dedicated mobile app, users experience a consistent interface. The mobile applications for Android and iOS are optimized for quick, on-the-go analysis, making it easier to monitor markets and execute trades anytime, anywhere.
Additional Features
- Integrated Trading: Connects directly to brokerage accounts for executing trades from charts.
- Stock Screeners and Market News: Advanced filters help identify trading opportunities efficiently.
- Backtesting and Strategy Testing: Enables users to evaluate how strategies would have performed historically.
Market Reach and Popularity Insights
Trading View has witnessed exponential growth in recent years, with over 60 million users worldwide. Its popularity is driven by its comprehensive data coverage, intuitive interface, and active community. The platform’s widespread adoption spans independent traders, institutional investors, financial educators, and data analysts.
In particular, its focus on cryptocurrencies has propelled it into the mainstream, with dedicated sections for Bitcoin, Ethereum, and other major digital assets. Additionally, the availability of market indices like S&P 500, NASDAQ, and Dow Jones—plus global forex pairs—ensures that users have access to a complete market overview. The platform’s mobile apps and social media presence further extend its reach, making Trading View a dominant name in the financial technology landscape.
Setting Up Your Trading View Workspace for Success
Creating Custom Watchlists and Alerts
Effective trading starts with organization. Trading View allows users to design personalized watchlists, grouping assets by categories, sectors, or strategies. This focus ensures quick access to relevant markets. Alerts can be set for specific price levels, indicator crossings, or technical formations. For example, a trader might create an alert for GBP/USD crossing above a certain resistance level, triggering an immediate notification to act swiftly.
Choosing the Right Chart Types and Indicators
Choosing appropriate chart types is critical for accurate analysis. Candlestick charts are popular for spotting entry and exit points, while line charts help identify broader trends. Applying multiple indicators, such as moving averages combined with RSI, offers a multi-dimensional view of market sentiment. Experimentation with different configurations enables traders to optimize their setups according to their trading style and objectives.
Integrating Trading Strategies into Your Layout
Many users incorporate strategy templates directly into their workspace. For instance, traders can develop, test, and apply Pine Script-based strategies that visually overlay buy/sell signals on charts. Saving layouts that combine multiple indicators, tools, and notes allows for quick setup during live trading sessions, ensuring nothing is overlooked and facilitating faster decision-making.
Advanced Techniques for Market Analysis with Trading View
Leveraging Technical Analysis Tools
Advanced traders utilize a spectrum of technical analysis tools to decipher complex market signals. Fibonacci retracements help identify potential reversal zones, while Bollinger Bands can signal overbought or oversold conditions. Chart patterns such as head and shoulders, flags, and cup & handle formations are visually recognizable with Trading View’s annotation tools. Incorporating volume analysis adds confirmation to price movements, leading to more confident trades.
Utilizing Community Ideas and Social Features
Trading View’s community ideas feature acts as a crowdsourced intelligence hub. Users can publish their analysis, receive feedback, and adapt insights shared by others. Monitoring popular ideas or trending discussions provides early signals about market sentiment shifts. Active participation also helps traders develop a critical eye and refine their analysis skills.
Automating Trades and Setting Up Notifications
Automation is increasingly accessible through Trading View’s integration with brokerages. Users can implement alerts that trigger trades automatically based on certain conditions—eliminating emotional decision-making. Additionally, custom notifications keep traders updated on key metrics, allowing them to respond swiftly to market developments without constantly monitoring charts.
Best Practices for Trading View Users
Optimizing Your Workflow for Speed and Accuracy
Efficient workflows can be achieved by customizing toolbars, saving templates, and streamlining alert setups. Keyboard shortcuts and scripting reduce analysis time, enabling traders to stay ahead in volatile markets. Regularly updating layouts and strategies ensures alignment with evolving market conditions.
Practicing Risk Management and Strategy Testing
Thorough testing of strategies through backtesting and paper trading minimizes risks. Trading View’s simulation features allow users to refine signals before deployment. Adopting fixed risk-per-trade rules and setting stop-loss orders are vital for protecting capital amidst unpredictable price swings.
Maintaining Continuous Learning and Updates
The financial markets are dynamic, demanding traders stay informed about new tools, indicators, and strategies. Following industry experts, subscribing to Trading View’s official updates, and participating in community discussions facilitate ongoing education and adaptation.
Measuring Success and Improving Your Trading Strategies
Analyzing Performance Metrics
Post-trade analysis is crucial. Trading View provides performance dashboards and trade journals to track win/loss ratios, profit/loss, and risk-adjusted metrics. Reviewing these figures helps identify the most successful setups and areas needing refinement.
Adjusting Strategies Based on Data
Data-driven adjustments involve tweaking indicator parameters, altering entry/exit rules, or managing position sizes based on historical results. Continuous iteration based on performance metrics improves consistency and profitability over time.
Staying Ahead with Market Trends and News
Integrating live news feeds and economic calendars into Trading View ensures traders are aware of macroeconomic shifts influencing markets. Staying informed helps prevent surprises and supports timely strategic adjustments, maintaining a competitive edge.